Traefik as Reverse Proxy

A few days ago I had the joy to configure a reverse proxy. My first thoughts went to Nginx or Apache, but I forced myself to destroy the filter bubble and get in touch with some new software. Therefore I had a lookon traefik. traefik is written in Golang and can act as reverse proxy and loadbalancer.
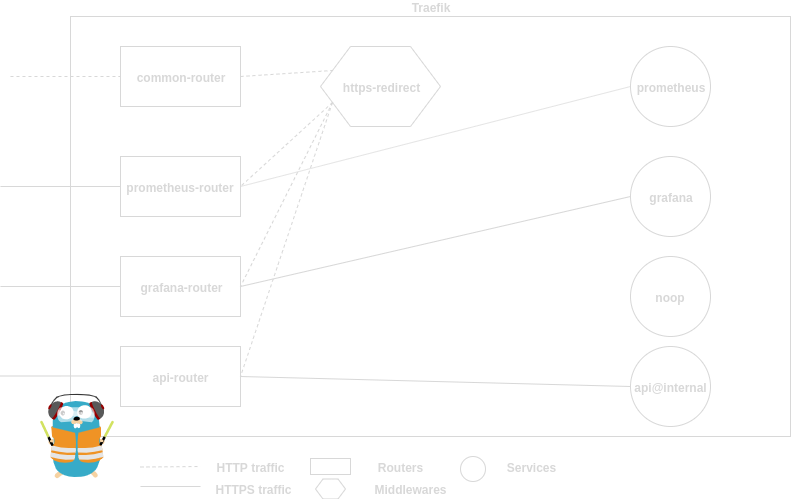
So let’s talk about a specific use case. I have the following services that I want to make available behind a reverse proxy:
- prometheus
- grafana
- the traefik dashboard and API
Furthermore I want to access all these services via a sub path and via HTTPS only, hence I need a HTTP to HTTPS redirect.
Achieving this wasn’t so easy. traefik 2.0 just got released, the documentation is fresh and thus we are lacking real world examples.
I’ve ended up with the following /etc/traefik/traefik.yml configuration:
---

providers:
  file:
    filename: /etc/traefik/traefik.yml

log:
  level: debug

api:
  dashboard: True

entryPoints:
  web:
    address: ":80"
  web-secure:
    address: ":443"
  metrics:
    address: ":8082"

metrics:
  prometheus:
    entryPoint: metrics

accessLog: {}

http:
  routers:
    common:
      rule: "HostRegexp(`{host:.+}`)"
      service: noop
      entryPoints:
        - web
      middlewares:
        - https-redirect
    prometheus-router:
      rule: "PathPrefix(`/prometheus`)"
      service: prometheus
      entryPoints:
        - web-secure
      tls: {}
    grafana-router:
      rule: "PathPrefix(`/grafana`)"
      service: grafana
      entryPoints:
        - web-secure
      tls: {}
    api-router:
      rule: "PathPrefix(`/api`) || PathPrefix(`/dashboard`)"
      service: api@internal
      entryPoints:
        - web-secure
      tls: {}
  middlewares:
    https-redirect:
      redirectScheme:
        scheme: https
        permanent: true
        port: 443
  services:
    prometheus:
      loadBalancer:
        servers:
          - url: "http://127.0.0.1:9090/"
    grafana:
      loadBalancer:
        servers:
          - url: "http://127.0.0.1:3000/"
    noop:
      loadBalancer:
        servers:
	  - url: "http://127.0.0.1/"

tls:
  certificates:
    - certFile: /etc/traefik/censored.cert
      keyFile: /etc/traefik/censored.key
Let’s have a look on it part by part. First we set a provider for the configuration:
providers:
  file:
    filename: /etc/traefik/traefik.yml
A file provider will watch the traefik.yml configuration file and adapt on changes in this file on runtime. Next we set logs for debugging (change this in production) and we enable the traefik dashboard.
log:
  level: debug

api:
  dashboard: True
With entrypoints we set the ingress for our reverse proxy. We want to listen on the standard HTTP and HTTPS ports (80 and 443) and on the traefik metrics port 8082. Speaking about metrics we need to enable them as well:
entryPoints:
  web:
    address: ":80"
  web-secure:
    address: ":443"
  metrics:
    address: ":8082"

metrics:
  prometheus:
    entryPoint: metrics
We want to enable access logs, too:
accessLog: {}
Next we configure the actual infrastructure with traefik. I use inline comments for better understanding:
http:
  # The routers will accept incoming connections and route them to the attached service over a middleware.
  routers:
    # The router `common` is our HTTP entrypoint. traefik wants a service here, thus we set a noop service.
    # This noop service will never be called.
    common:
      # We match on every hostname
      rule: "HostRegexp(`{host:.+}`)"
      service: noop
      entryPoints:
        - web
      # This middleware redirects the http traffic to the routers who listen on web-secure entrypoints.
      middlewares:
        - https-redirect
    # This router matches on the /prometheus path prefix, redirects traffic to the prometheus server
    # and enables TLS.
    prometheus-router:
      rule: "PathPrefix(`/prometheus`)"
      service: prometheus
      entryPoints:
        - web-secure
      tls: {}
    # The grafana-router enables TLS and matches on the /grafana path prefix.
    grafana-router:
      rule: "PathPrefix(`/grafana`)"
      service: grafana
      entryPoints:
        - web-secure
      tls: {}
    # The api-router matches on /api and /dashboard path prefixes and forwards the traffic
    # to the traefik internal API.
    api-router:
      rule: "PathPrefix(`/api`) || PathPrefix(`/dashboard`)"
      service: api@internal
      entryPoints:
        - web-secure
      tls: {}
  # This map describes the middlewares between routers and services. We use a redirect scheme for HTTPS here.
  middlewares:
    https-redirect:
      redirectScheme:
        scheme: https
        permanent: true
        port: 443
  # In services we just describe our services or targets where we want to forward traffic to.
  services:
    prometheus:
      loadBalancer:
        servers:
          - url: "http://127.0.0.1:9090/"
    grafana:
      loadBalancer:
        servers:
          - url: "http://127.0.0.1:3000/"
    noop:
      loadblanacer:
        servers:
	  - url: "http://127.0.0.1/"
Lastly we set the TLS certificate and key (note that we we need to use the hostname.cert or hostname.key scheme.
tls:
  certificates:
    - certFile: /etc/traefik/censored.cert
      keyFile: /etc/traefik/censored.key
For starting traefik you can use the following systemd service file:
[Unit]
Description=Traefik
Documentation=https://docs.traefik.io
After=network-online.target
AssertFileIsExecutable=/usr/local/bin/traefik
AssertPathExists=/etc/traefik/traefik.yml

[Service]
# Run traefik as its own user (create new user with: useradd -r -s /bin/false -U -M traefik)
User=traefik
AmbientCapabilities=CAP_NET_BIND_SERVICE

# configure service behavior
Type=notify
ExecStart=/usr/local/bin/traefik --configFile=/etc/traefik/traefik.yml
Restart=always
WatchdogSec=1s

# lock down system access
# prohibit any operating system and configuration modification
ProtectSystem=strict
# create separate, new (and empty) /tmp and /var/tmp filesystems
PrivateTmp=true
# make /home directories inaccessible
ProtectHome=true
# turns off access to physical devices (/dev/...)
PrivateDevices=true
# make kernel settings (procfs and sysfs) read-only
ProtectKernelTunables=true
# make cgroups /sys/fs/cgroup read-only
ProtectControlGroups=true

# allow writing of acme.json
#ReadWritePaths=/etc/traefik/acme.json
# depending on log and entrypoint configuration, you may need to allow writing to other paths, too

# limit number of processes in this unit
#LimitNPROC=1

[Install]
WantedBy=multi-user.target